A Primer on Spectroscopy
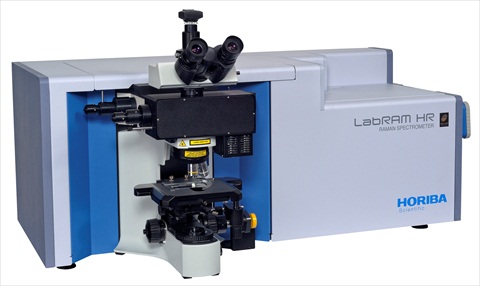
This image shows a Raman Spectrometer manufactured by “HORIBA Scientific”. This model is called “LabRAM HR Evolution spectrometer”.
Sir C.V. Raman observed that a molecular structure can be identified by the spectral analysis. Every unique molecular structure has a unique fingerprint. When light is incident on a sample of a substance, it results in scattering. The scattered waves have energy patterns that are shifted from the energy patterns of the incident light beam. This shifting is called Raman Shifting.
Image Credit: en.wikipedia.org/wiki/Raman_spectroscopy
colorado.edu/geologicalsciences/resources/research-facilities/raman-microspectroscopy-lab
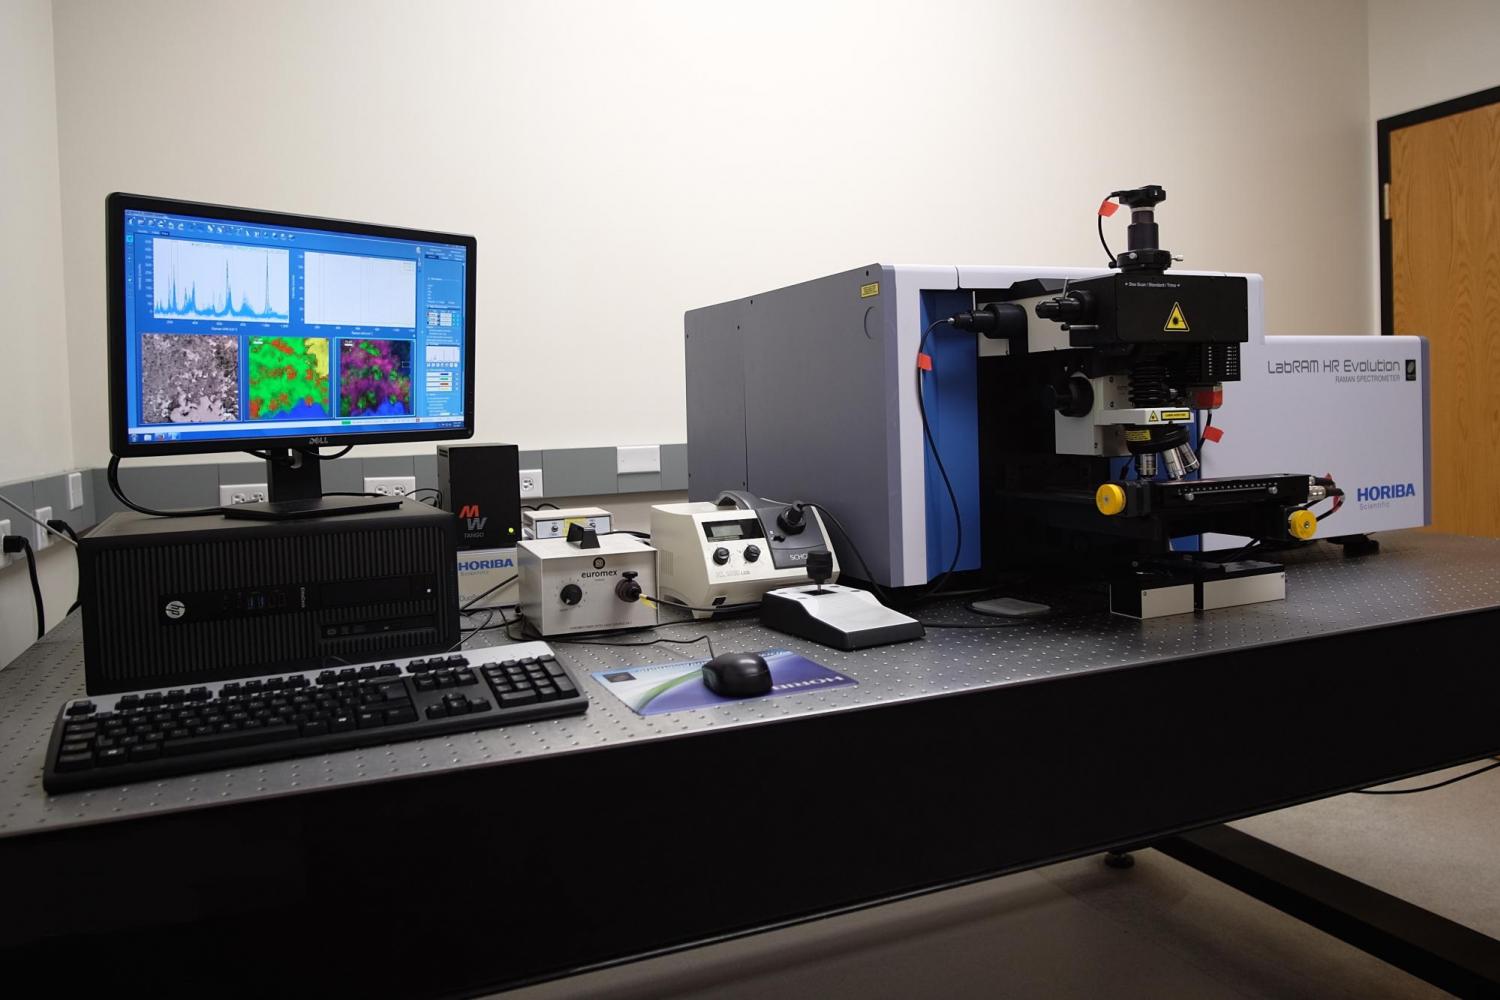
This image shows the complete setup of Raman Spectrometer connected with a computer and monitor. The output of the spectrometer is interfaced with the computer and a software draws the Raman Spectra on the screen.
megainteresting.com/nature/questions-answers/how-many-colours-are-in-a-rainbow-341585741669
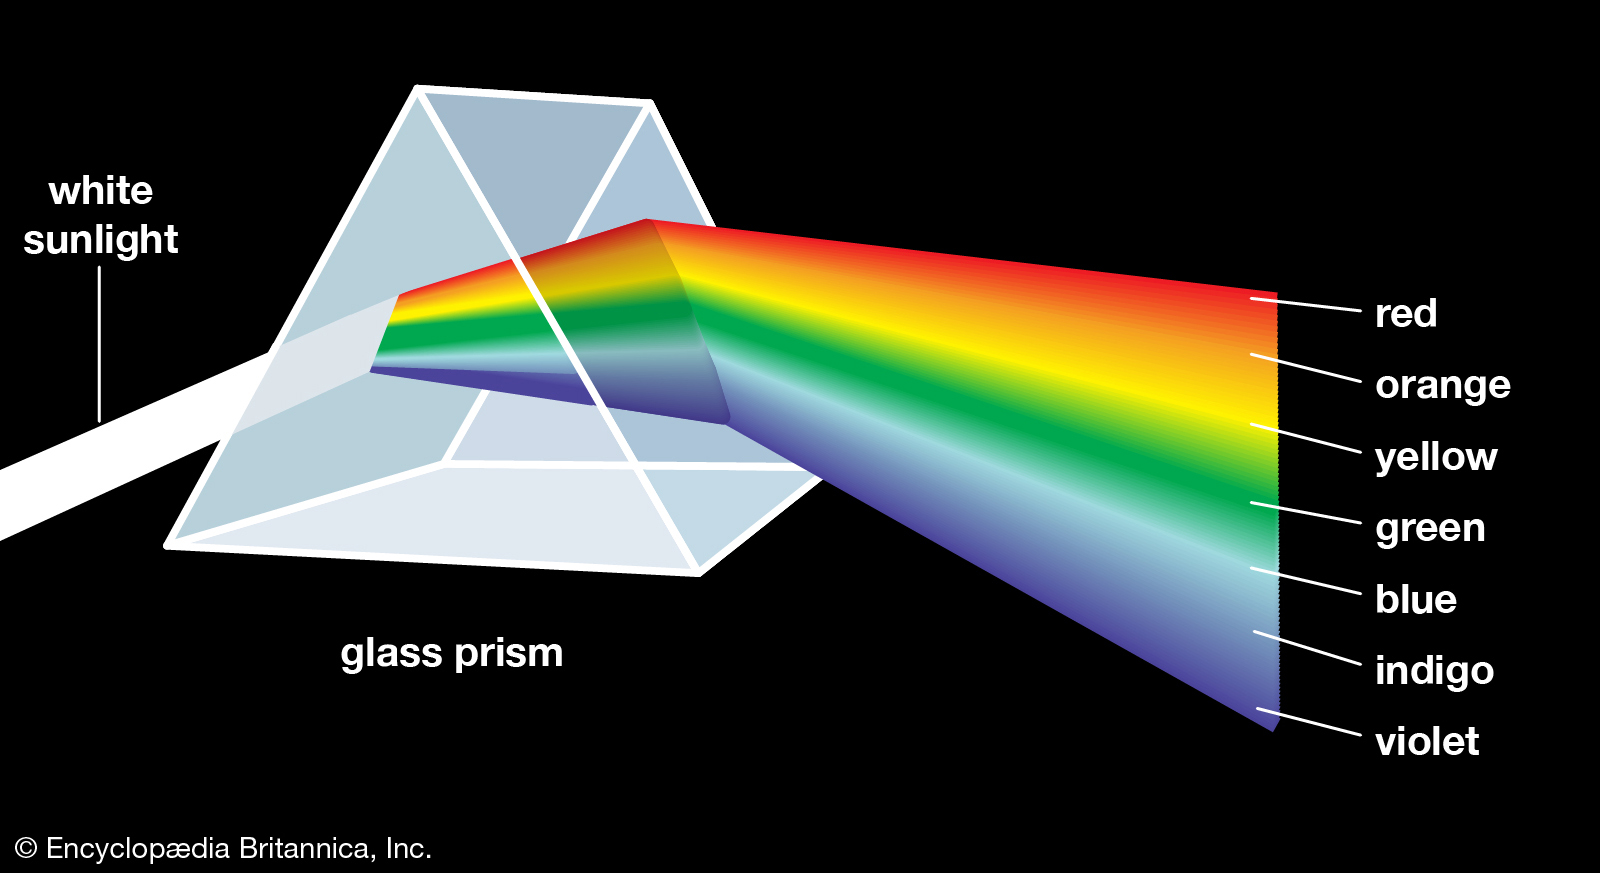
When the sunlight passes through the water molecules in the air on a cloudy rainy day, we see the rainbow. We see the same effect when the white light passes through a prism. This is the color spectrum of visible light. Visible light is a range of frequencies in the electromagnetic waves.
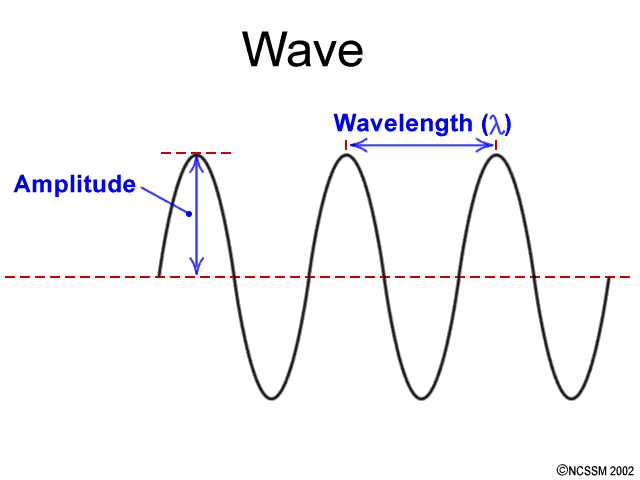
This image shows a wave and its characteristics: Amplitude and Wavelength. Light has dual nature. It behaves like waves in some situations and behaves like particles in other situations. Photon is the smallest unit of light. A photon has energy but virtually no mass.
1. The output wave has more energy than the input wave.
2. The output wave has same energy level as the input wave.
3. The output wave has less energy level than the input wave.
We know that energy cannot be created and nor destroyed. What happens to energy equations when electromagnetic waves hit the electrons?
Something very similar to when a customer visits a bank. The customer can deposit some cash and return back with less money in pocket. The customer can withdraw some cash and return back with more cash in the pocket. In this case, the electromagnetic wave is the customer, and the electron is the bank. The bank stays it its position.
What is important about this phenomenon? We can send detective electromagnetic waves to find out the identity of the molecule. Atoms are extremely small. There are a greater number of atoms in a dot than the number of people in the world. Raman Spectroscopy provides a method to detect the type of atoms in a sample of some substance. We can detect the presence of impurity in water.
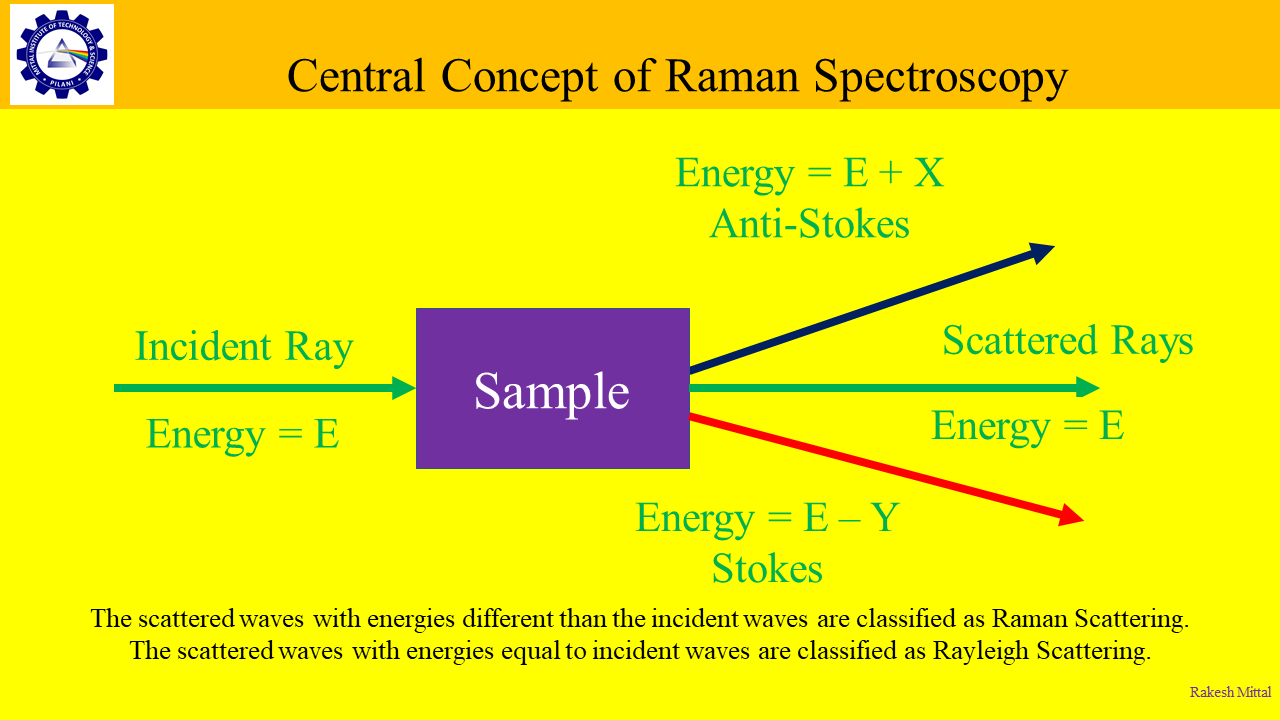
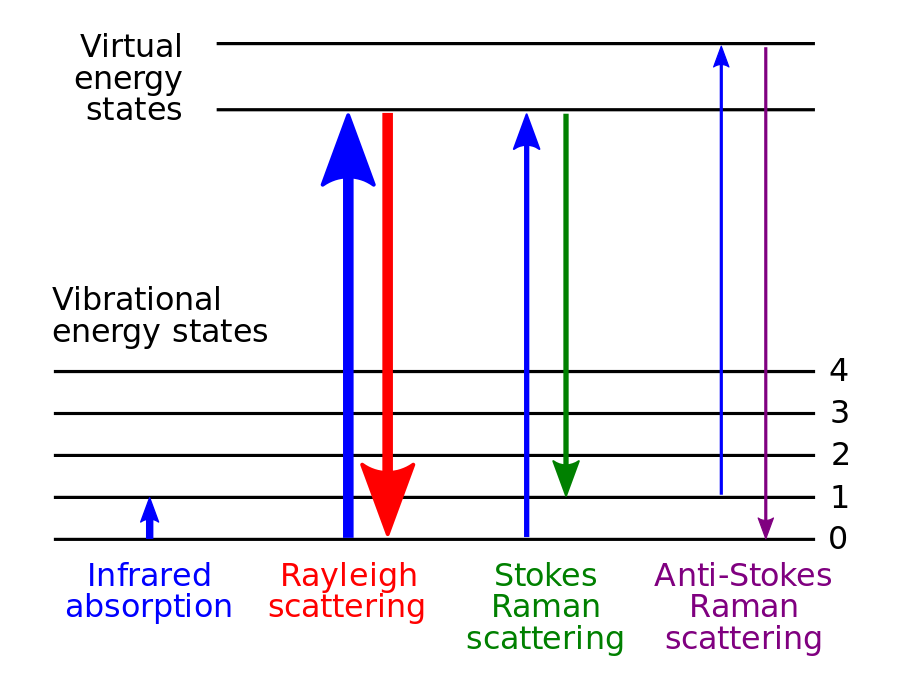
Among the scattered waves, some have same energy level as the incident waves. They are classified as Rayleigh scattering. Some waves have less energy than the incident waves and some have more energy than the incident waves. These are classified as the Raman scattering. A change in energy implies a change in wavelength. This change is called Raman Shift.
https://www.worldscientific.com/doi/10.1142/S1793545818410031
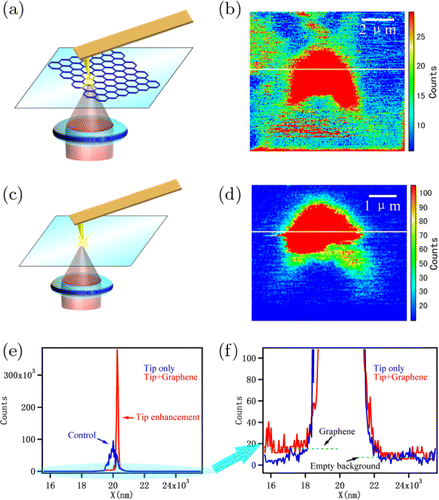
Image description: The measurement of tip enhancement effect. (a) and (b) The CARS imaging of both graphene and Au coated tip. (c) and (d) The control group in which only tip was imaged by CARS. (e) and (f) The signal intensity measurement of the white line in (b) (red) and (d) (blue).
CARS = Coherent Anti-Stokes Raman Scattering
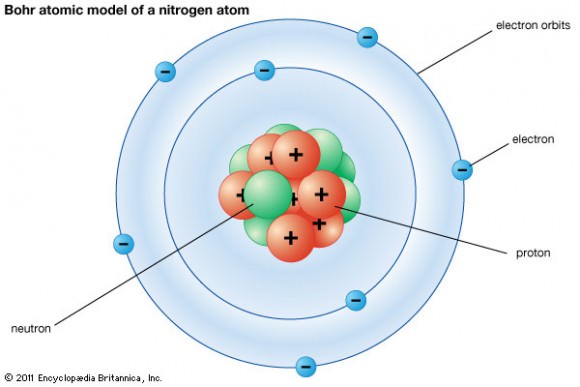
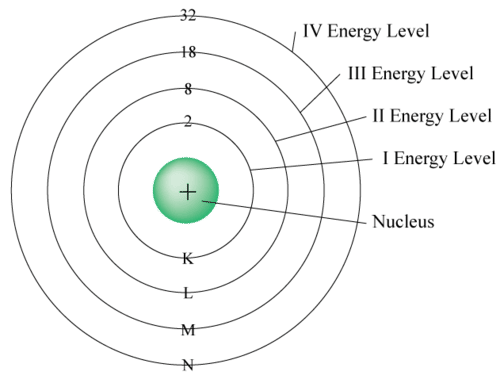
This image shows the energy levels of electrons in different shells and orbitals of an atom. When an electromagnetic wave hits an electron, the electron absorbs the wave and moves into higher energy level. When the electron radiates the electromagnetic wave, it loses energy and falls to a lower energy level. Electronic waves have dual nature and behave like particles as well. This particle is called photon.
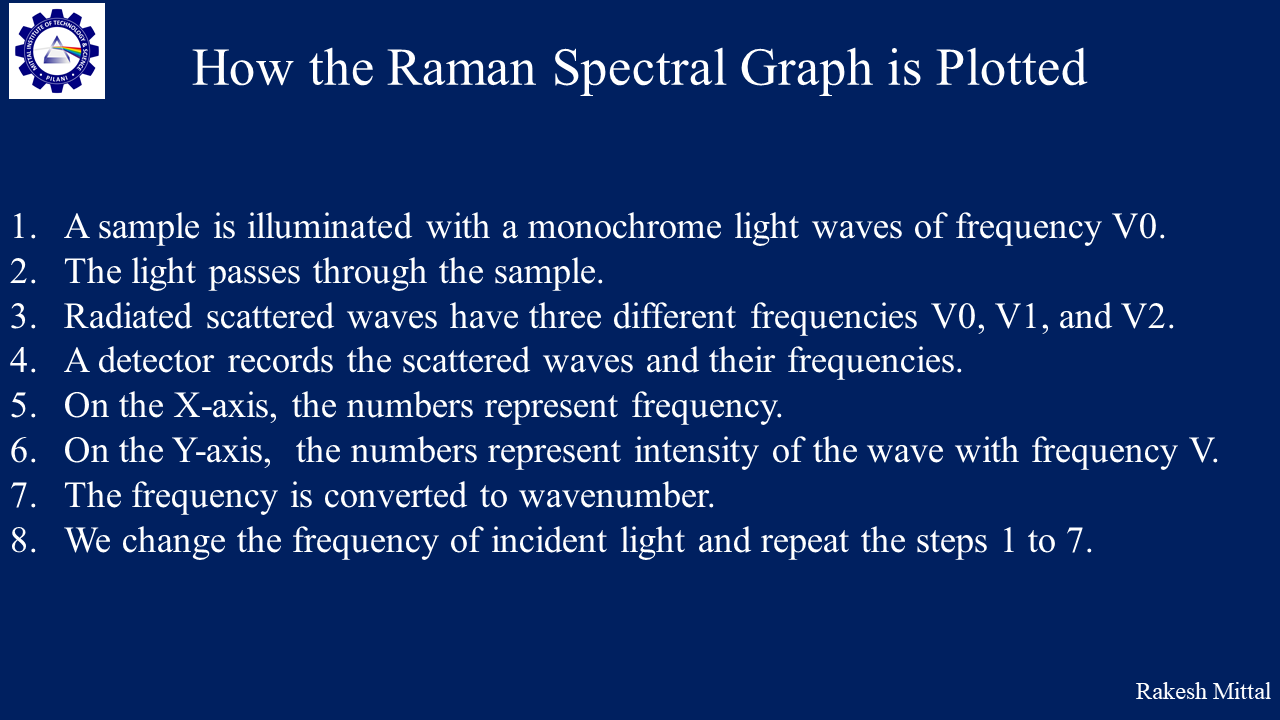
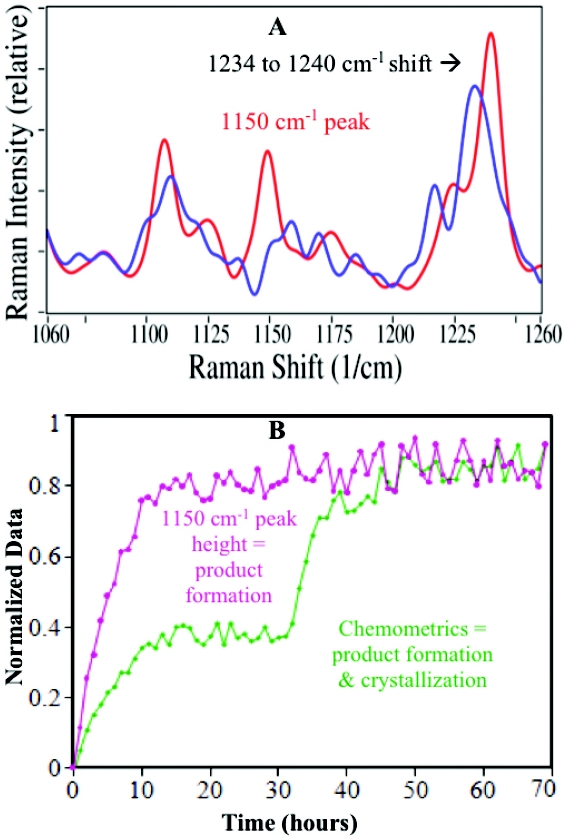
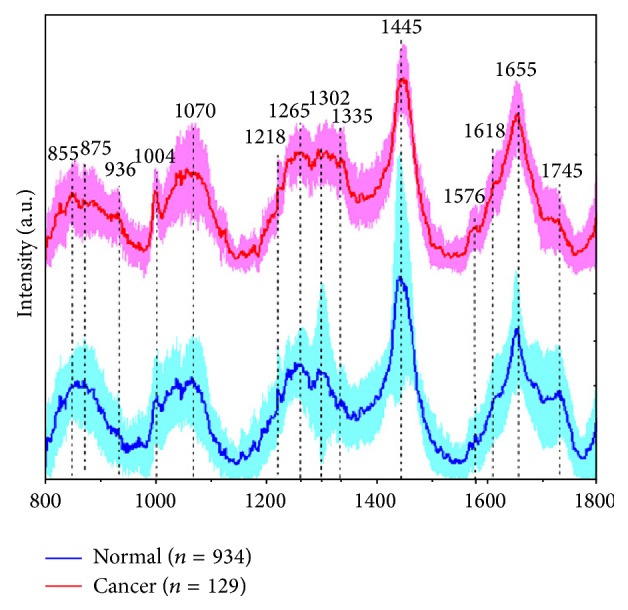
This image shows the graph plotted for Raman Shift. The Y-axis shows the intensity and X-axis shows the wavenumbers.
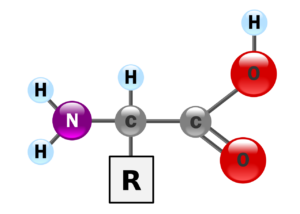
This image shows the molecular structure of Amino Acids. The circles represent atoms. The lines represent bonds between the atoms. Bonds between atoms are formed when they share electrons. This bond behaves like a spring connecting the two atoms and permits them to vibrate.
courses.lumenlearning.com/introchem/chapter/double-and-triple-covalent-bonds/
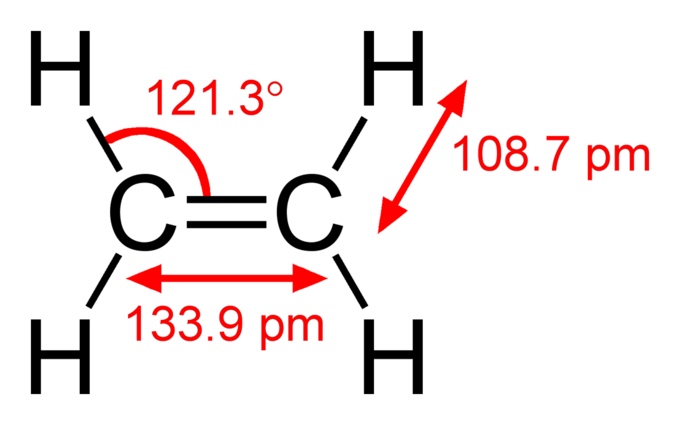
This image shows the double bond between two carbon atoms and single bonds between carbon and hydrogen atoms. Each bond has a length. There is an angle between two bonds. The length and angle are the properties of the bonds and represent the fingerprints for the molecules. Spectroscopy detects these fingerprints and identify the element or the compound.
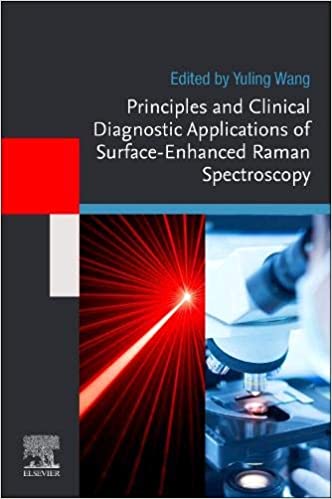
Principles and Clinical Diagnostic Applications of Surface-Enhanced Raman Spectroscopy summarizes the principles of surface-enhanced Raman scattering/spectroscopy (SERS) and plasmonic nanomaterials for SERS, with a focus on SERS applications in clinical diagnostics. This book covers the key concepts from the fundamentals, materials, experimental aspects, and applications of SERS in clinical diagnostics with discussions on label-free/direct SERS assay, design and synthesis of SERS nanotags, SERS nanotags for point-of-care diagnostics, microfluidic SERS assay, and in vitro and in vivo sensing and imaging.

Contact: RakeshMittal@ScientificPilani.com
For many years the practice of Raman spectroscopy was confined to experts in dedicated research laboratories. The instruments were large, complicated and the experiments could be quite complex. With advances in modern technology, Raman spectrometers have become small, portable and are regularly used by people who are neither specialist spectroscopists nor analysts.
Raman scattering is widely
used to provide information on chemical structures and physical forms, to identify substances from the characteristic spectral patterns (‘fingerprinting’), and to determine quantitatively or semi-quantitatively the amount of a substance in a sample. Samples can be examined in a whole range of physical states; for example, as solids, liquids or vapours, in hot or cold states, in bulk, as microscopic particles, or as surface layers.
